
 7 Minute Read
Contents:
There are three things guaranteed in life: death, taxes, and a question on NMR spectroscopy in your A Level Chemistry exam paper! While I can’t help with the first two, in this article, I’ll guide you through how to interpret NMR spectra and break the process down into manageable steps that you can apply to any NMR question.
Exam boards vary in what they expect you to know about how the NMR process works, but this article will focus specifically on how to interpret the spectra.
There are two types of NMR spectra you could be asked about: 13C NMR and 1H NMR. We’ll look at 13C NMR first.
13C NMR spectroscopy in A Level Chemistry
13C NMR is the simpler of the two types of NMR spectroscopy. Each peak represents a different carbon environment. Let’s take a closer look at propan-2-ol as an example.
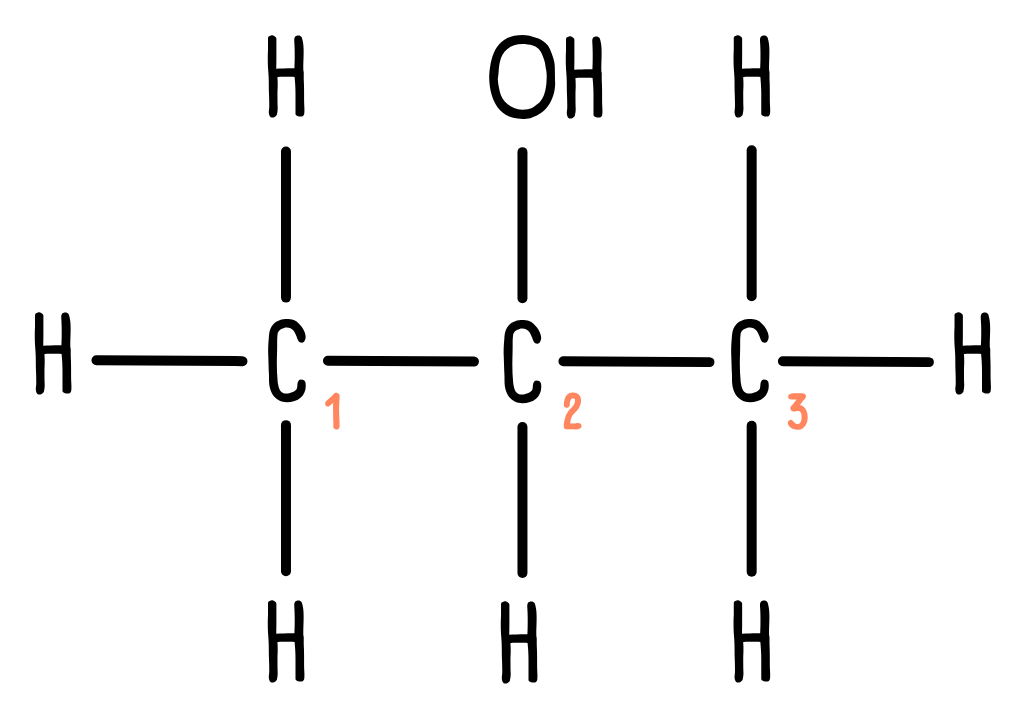
Propan-2-ol contains three carbon atoms. However, since the molecule is symmetrical, carbon atoms 1 and 3 are identical – if you were to view the molecule from the opposite side, it would look exactly the same. We say there are two unique carbon environments, so we would expect to see two peaks in the 13C NMR spectrum.
But which peak is which? The distance from 0 on the x-axis is called the chemical shift. All exam boards provide a data sheet with chemical shift values. Below is a section from the AQA Chemistry A Level data sheet.
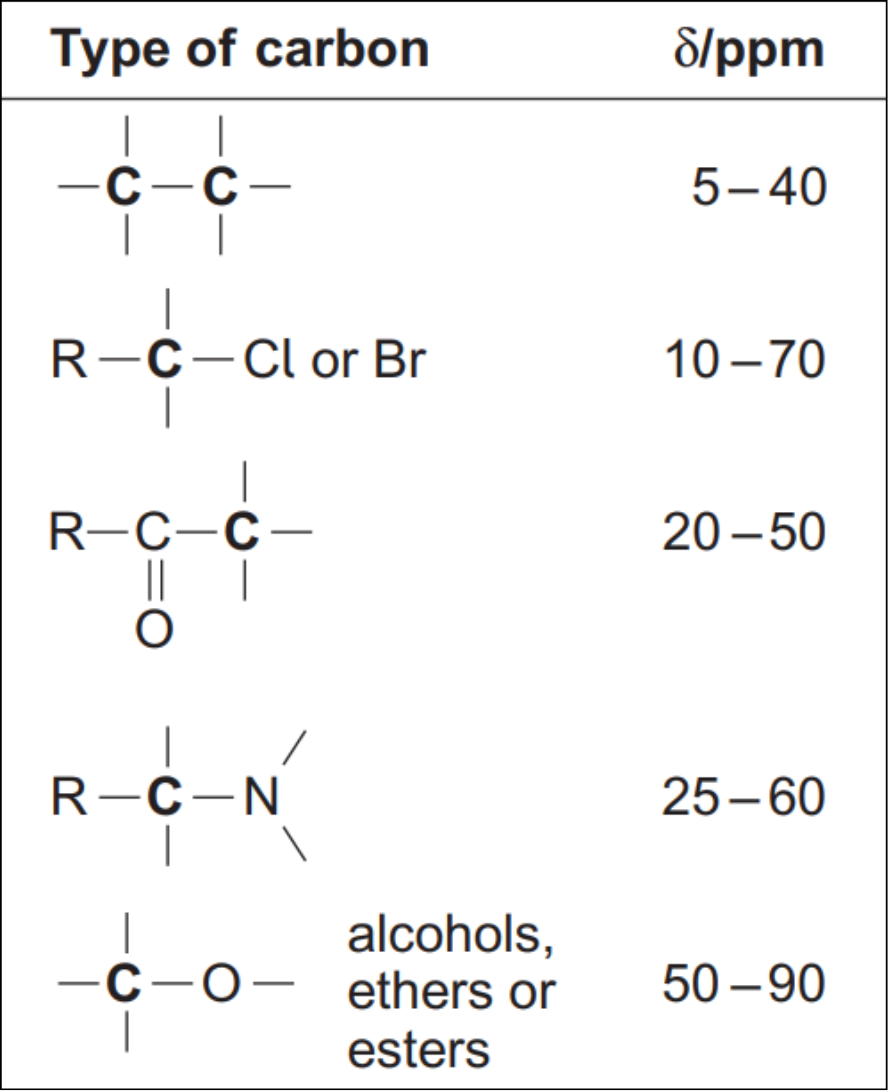
Carbon atoms 1 and 3 are only attached to carbon and hydrogen atoms, so we would expect a peak in the 5-40 ppm region. Carbon atom 2 is bonded to an oxygen atom. Looking at the data sheet, we can expect a peak between 50-90 ppm.
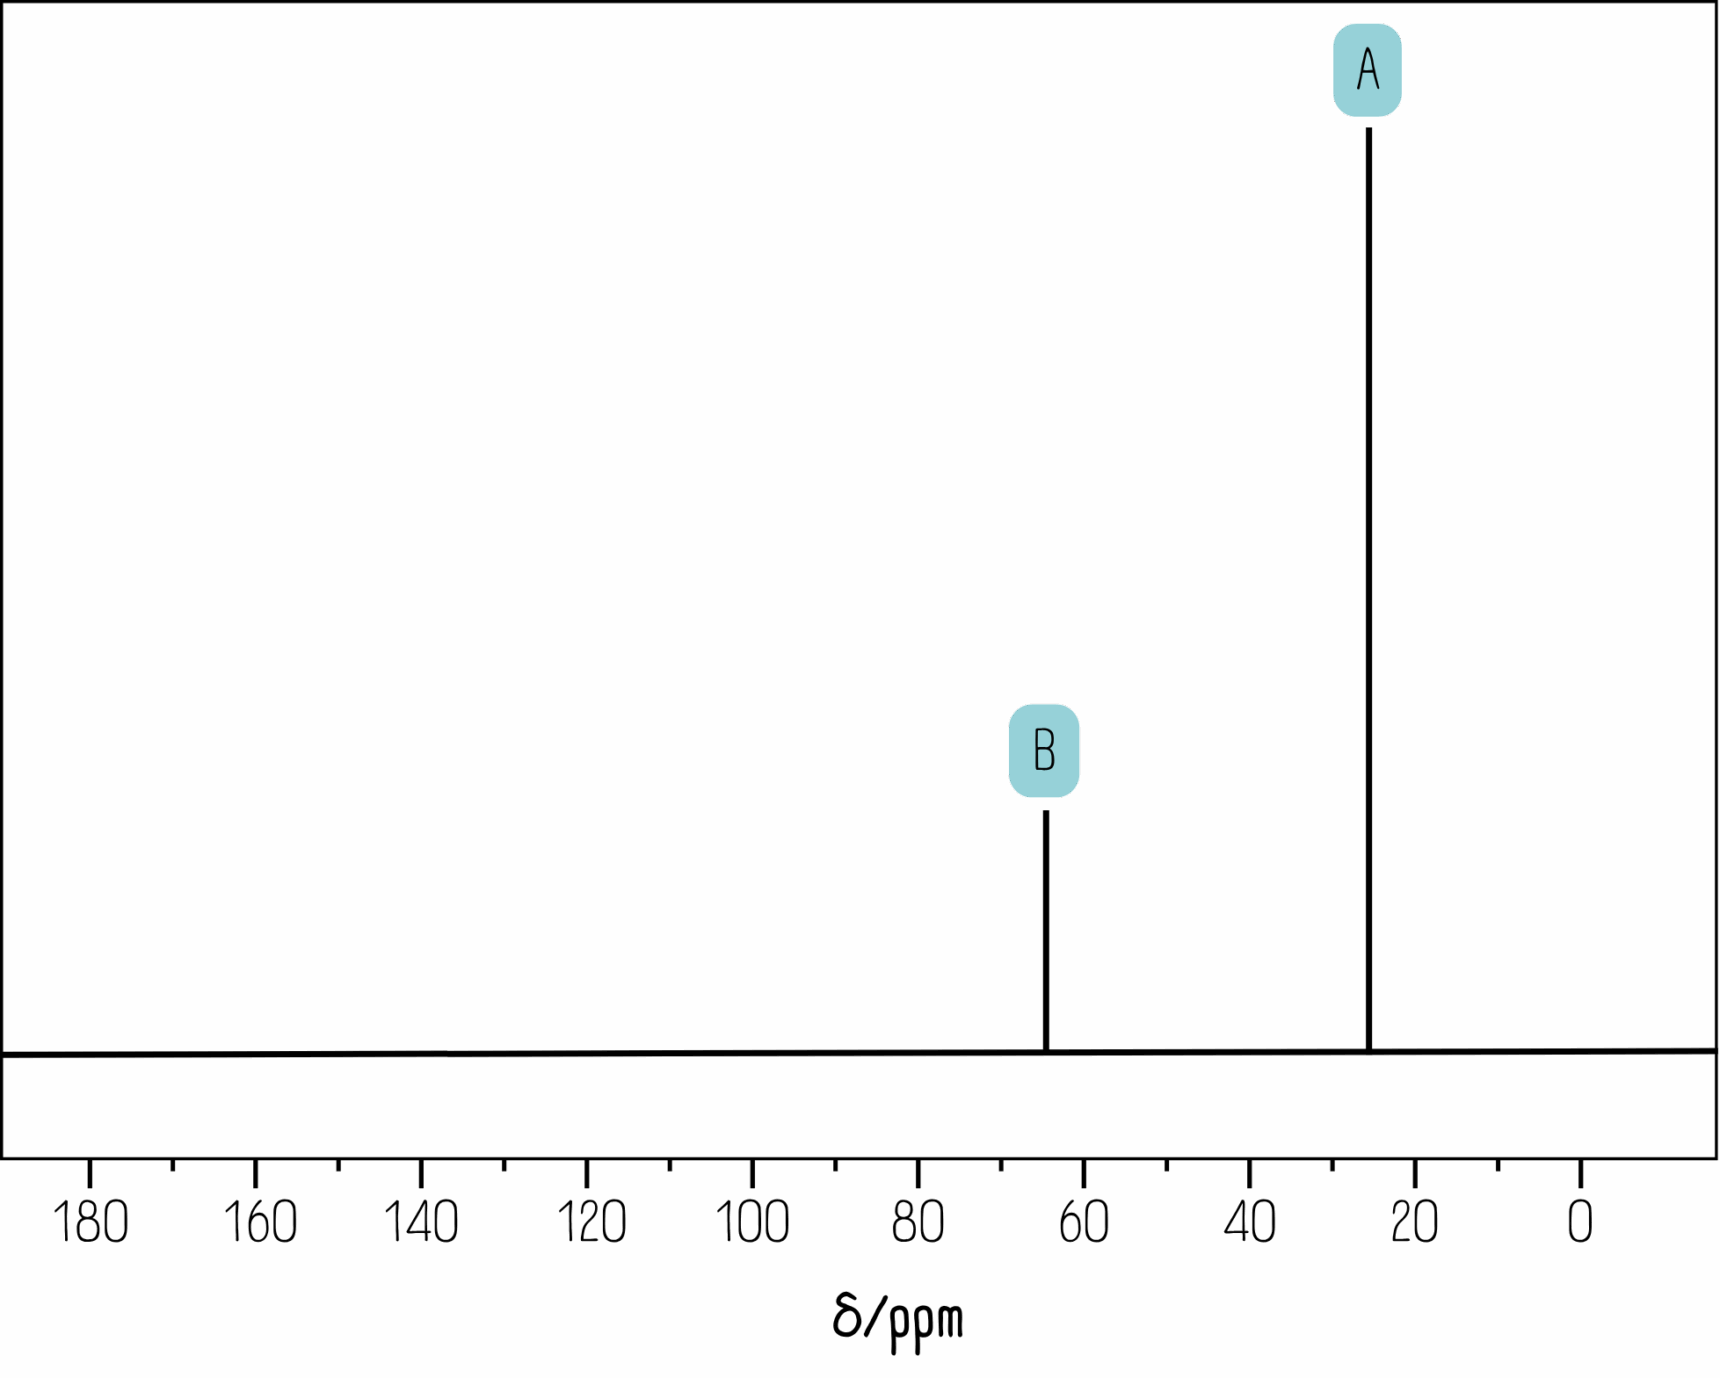
Looking at the spectrum, we can see there is a peak around 25 ppm (peak A) and another around 65 ppm (peak B). Peak A must correspond to carbon atoms 1 and 3, while peak B must correspond to carbon 2.
It’s worth noting that the scale is relevant to a standard chemical, tetramethylsilane (TMS), which gives a single peak at 0 ppm by definition. This applies to both 13C NMR and 1H NMR.
The data sheets provided by different exam boards look quite different, but the information given is the same. Familiarise yourself with your specific data sheet so you don’t waste time looking for the information you need in your exam.
1H NMR spectroscopy in A Level Chemistry
1H NMR spectroscopy provides more information than 13C NMR. There are three key features to look at:
- Chemical shift values
- Integration values
- Splitting patterns
Chemical shift values
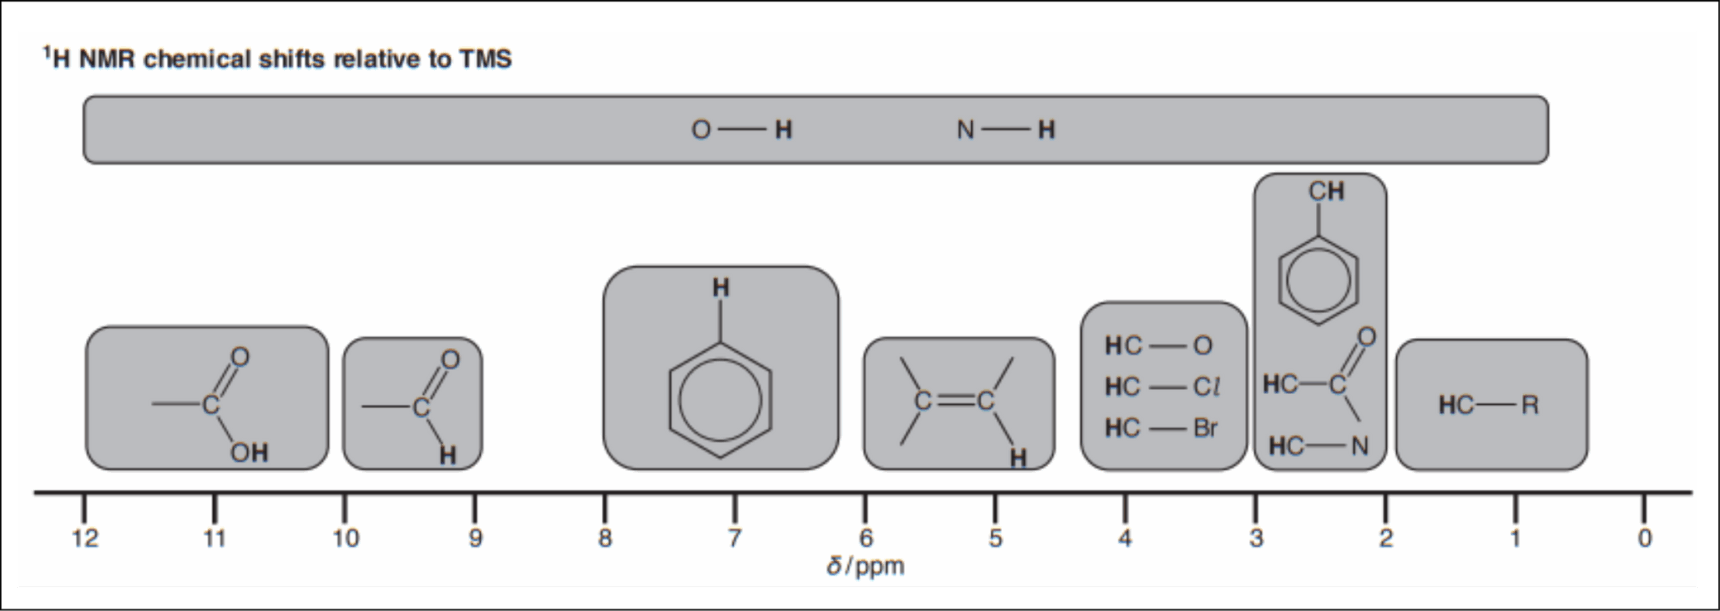
This is very similar to 13C NMR, where you look at the data sheet to find the range in chemical shift. However, this time you’re looking at hydrogen atoms which share a carbon atom with various groups. A section of the OCR (A) data sheet is shown below:
Let’s take another look at propan-2-ol.
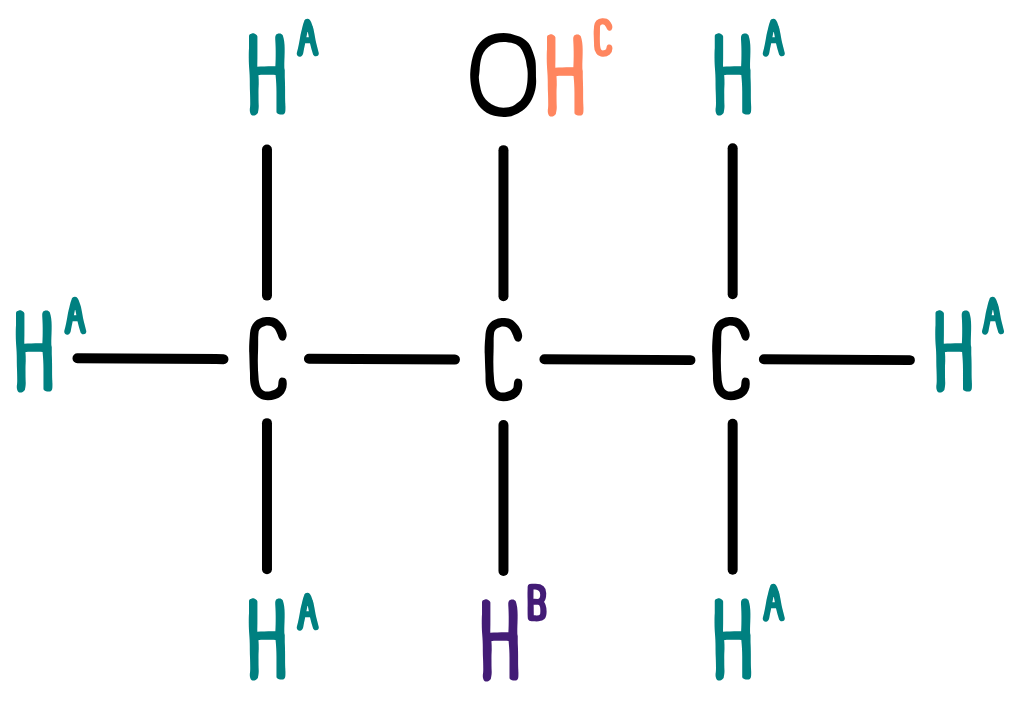
Again, we need to look at the number of different environments, but this time for hydrogen. The molecule has two equivalent CH3 groups, one CH group, and one OH group. Therefore, we would expect to see three distinct peaks in the 1H NMR spectrum.
Now we look at the data sheet. The CH3 groups are connected to a carbon atom, so we would expect a peak in the range 0.5-2.0 ppm. The CH group is also bonded to an alcohol group. The data sheet tells us to expect a peak between 3.0-4.2 ppm. Finally, the OH group could appear anywhere between 1.0-12.0 ppm.
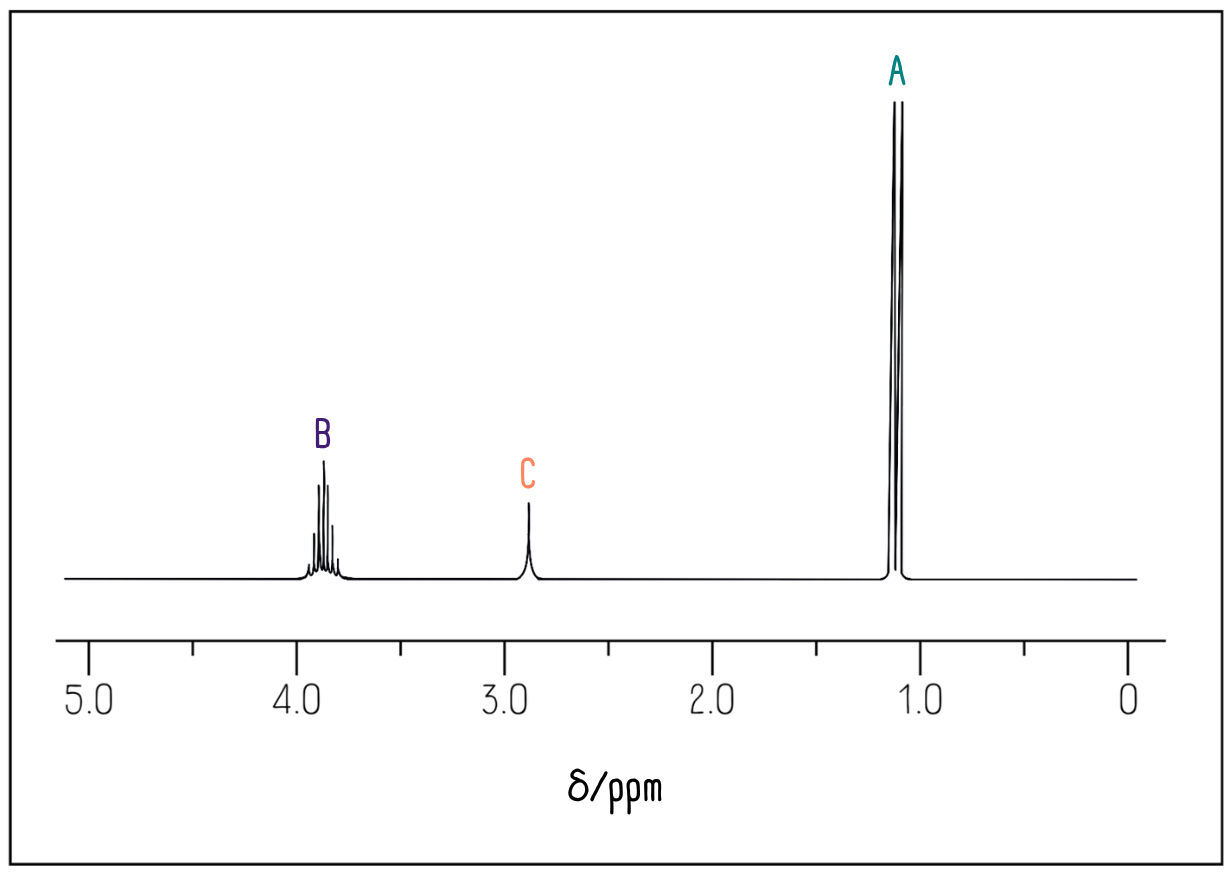
This is what we see in the spectrum:
Integration values
If you measure the area under each peak, you can determine the relative number of hydrogen atoms represented by each peak. In the exam, you’ll be given integration numbers. It’s important to remember that these are the simplest ratio – your actual molecule could have multiples of these. Let’s look at an example.
Chloroethane looks like this:

We have two different hydrogen environments: a CH2Cl group and a CH3 group. Therefore, we would expect the integration values to have a 2:3 ratio, which is exactly what we observe in the spectrum:
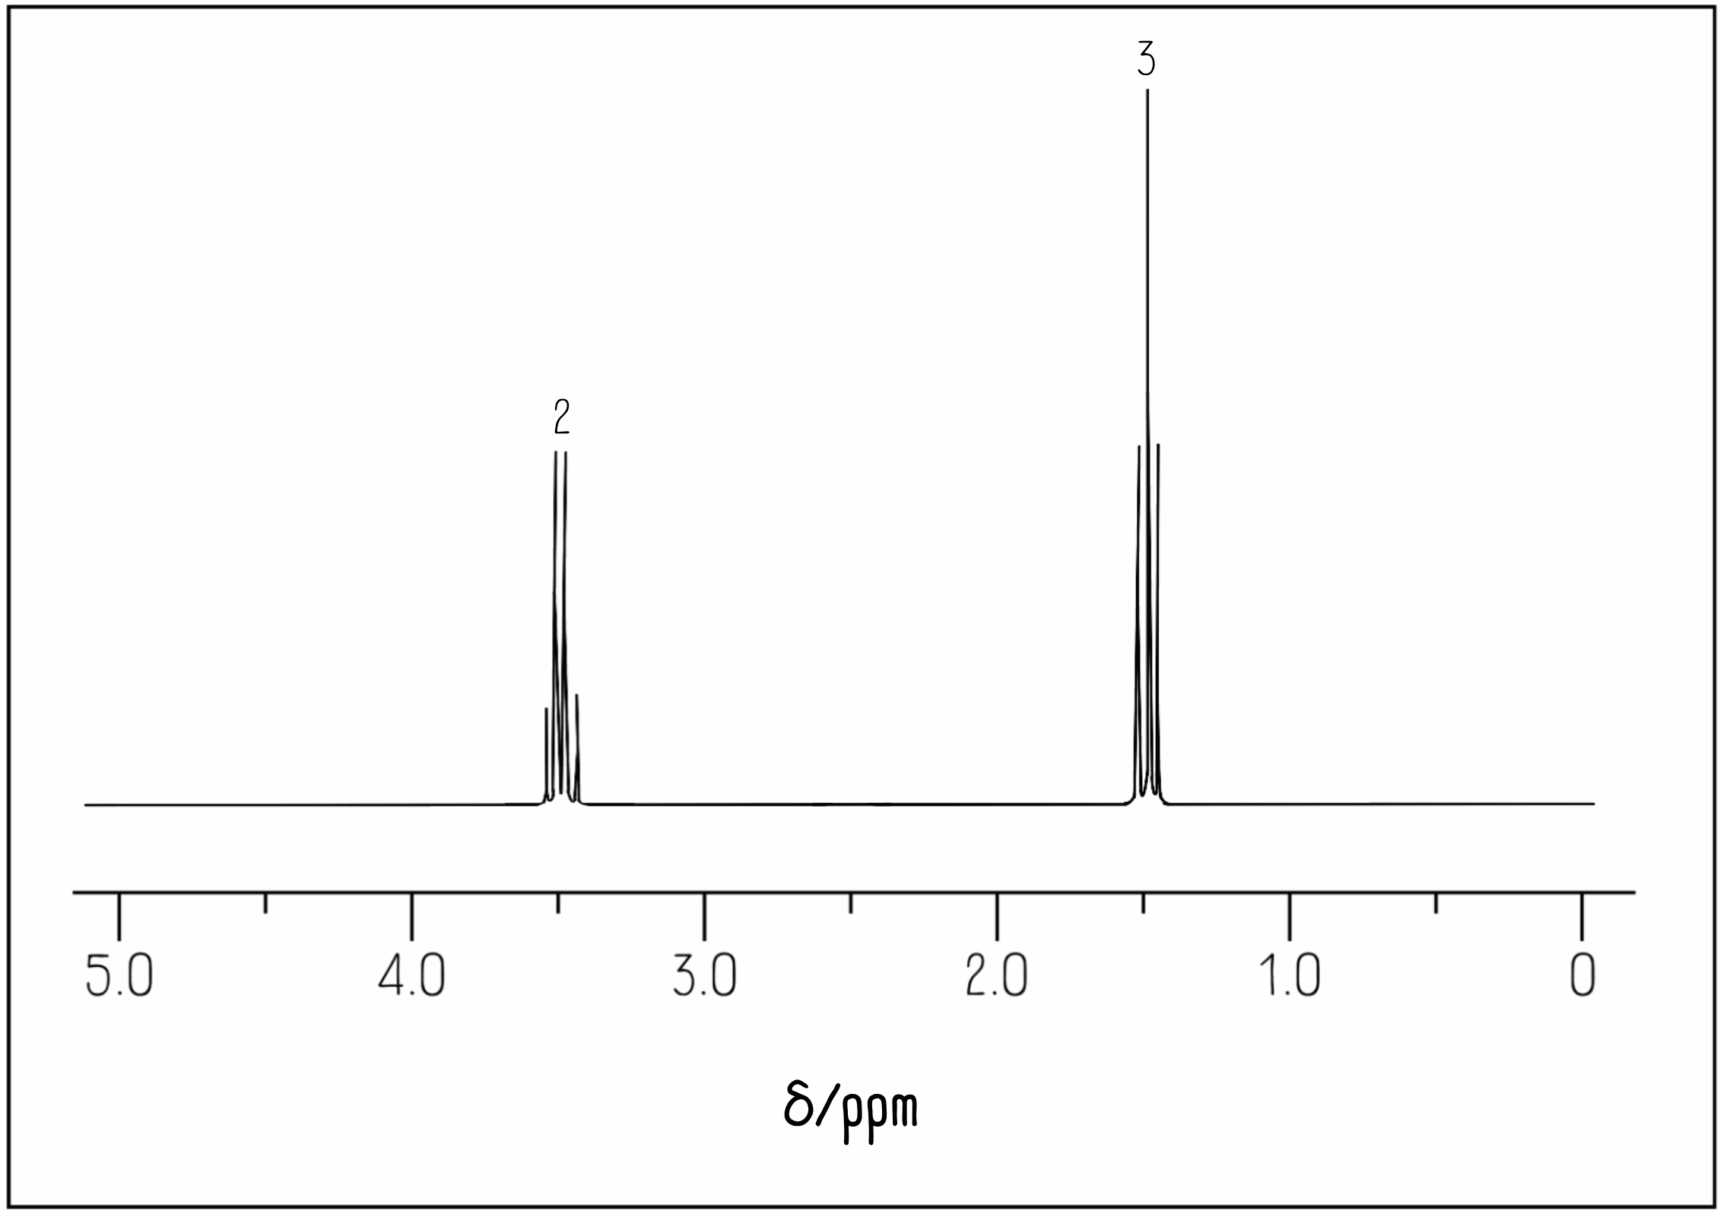
The numbers above each peak represent the integration values for each peak. They give the relative ratio of hydrogen atoms in each environment.
However, beware! Other molecules may have the same integration values. For instance, pentan-3-one looks like this:
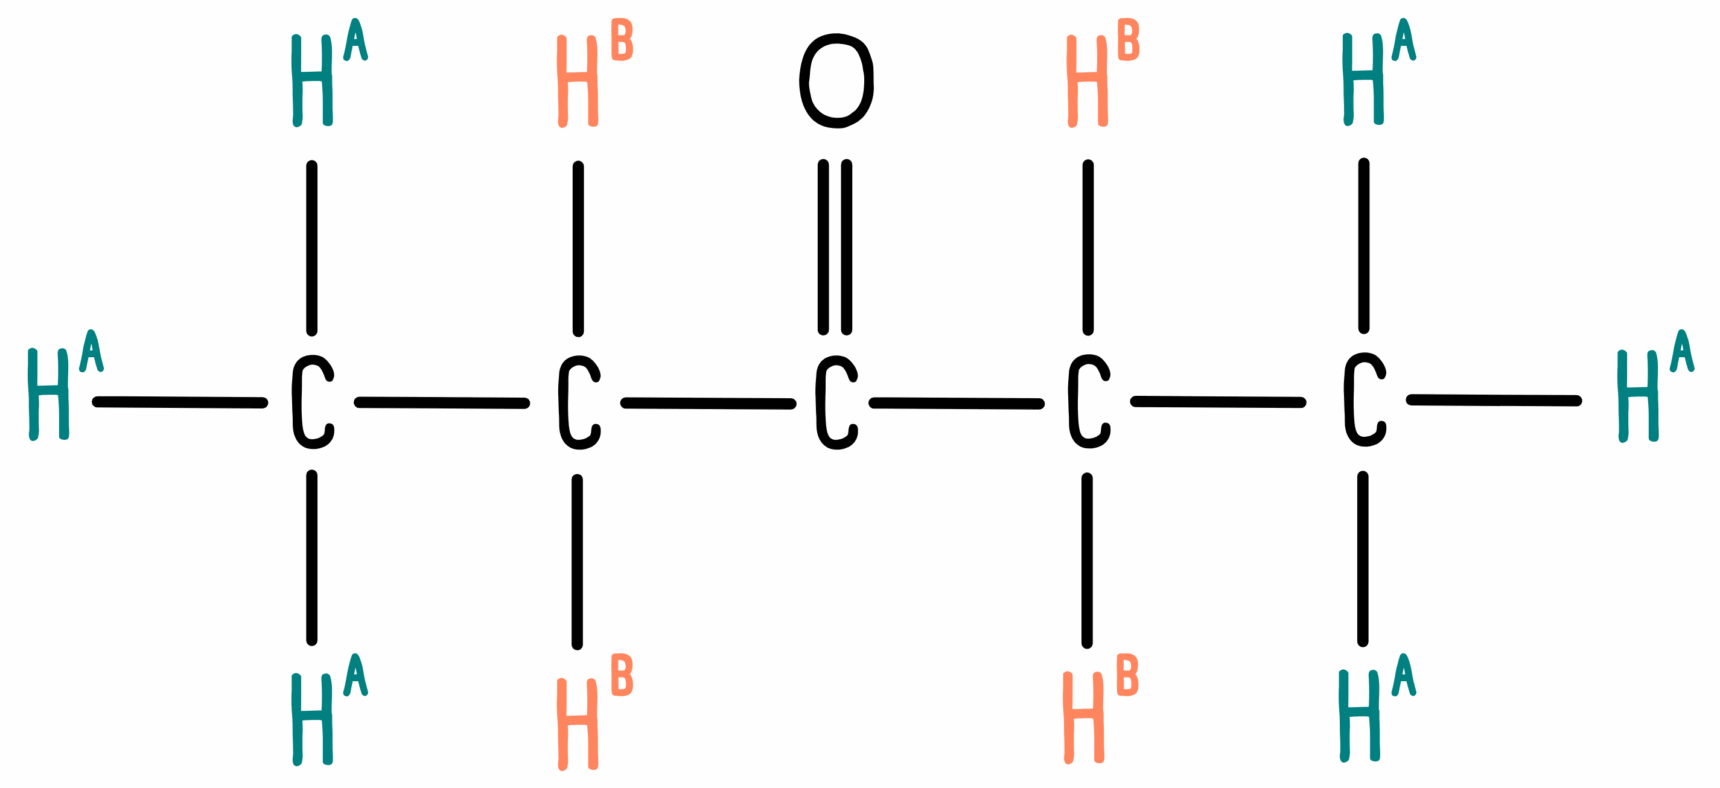
We can see that the molecule contains two different hydrogen environments, A and B. Since the two CH3 groups are equivalent and the two CH2 groups are equivalent, we have six hydrogen atoms in environment A and four in environment B. However, the integration values for these peaks will be 3 and 2.
The 1H NMR spectrum for this molecule looks like this:
Because the simplest ratio of hydrogen environments is 2:3, we can’t determine from the integration values alone whether there are exactly 2 and 3 hydrogen atoms, or perhaps 4 and 6, or any other multiple of this ratio.
Splitting patterns
This is the part students often find most confusing, so we’ll break it down into small steps. Let’s look again at propan-2-ol.

We already know we will see three peaks, but they will look different due to splitting. The n+1 rule is key here:
A peak will be split into a number of smaller peaks based on the number of hydrogen atoms on adjacent carbon atoms, n, plus 1.
Let’s look at the CH3 group. This group is adjacent to a CH, so there is one hydrogen atom on the adjacent carbon atom (n = 1). We expect to see the CH3 signal split into n + 1 peaks, so we will see two peaks, or a doublet.
Next, let’s look at the CH group. There are six hydrogen atoms on adjacent carbon atoms (n = 6). We expect to see the signal split into n + 1 peaks, or seven peaks in total.
The final hydrogen environment is the OH group. Since this is not attached to a carbon atom we assume it won’t split at all. We expect to see a single peak, or a singlet. Unless stated otherwise, we can ignore any hydrogen atoms bonded to anything other than carbon.
The splitting patterns you will be expected to interpret will vary depending on your exam board. For example, AQA asks for interpretation of splitting up to four peaks. WJEC only expects students to be able to interpret splitting from one adjacent carbon atom. If in doubt, consult your exam board specification!
Example
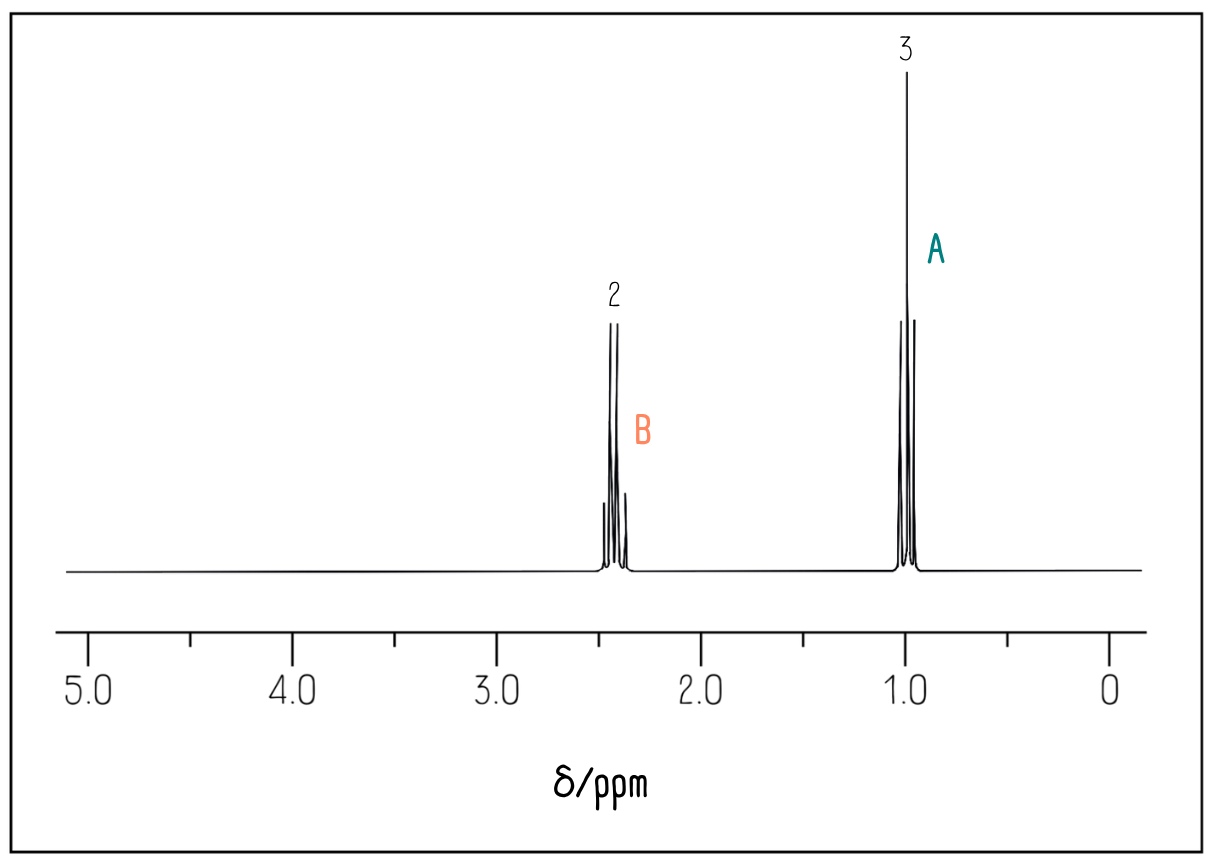
Let’s determine the 1H NMR spectrum for another molecule. The structure for ethanol is below.
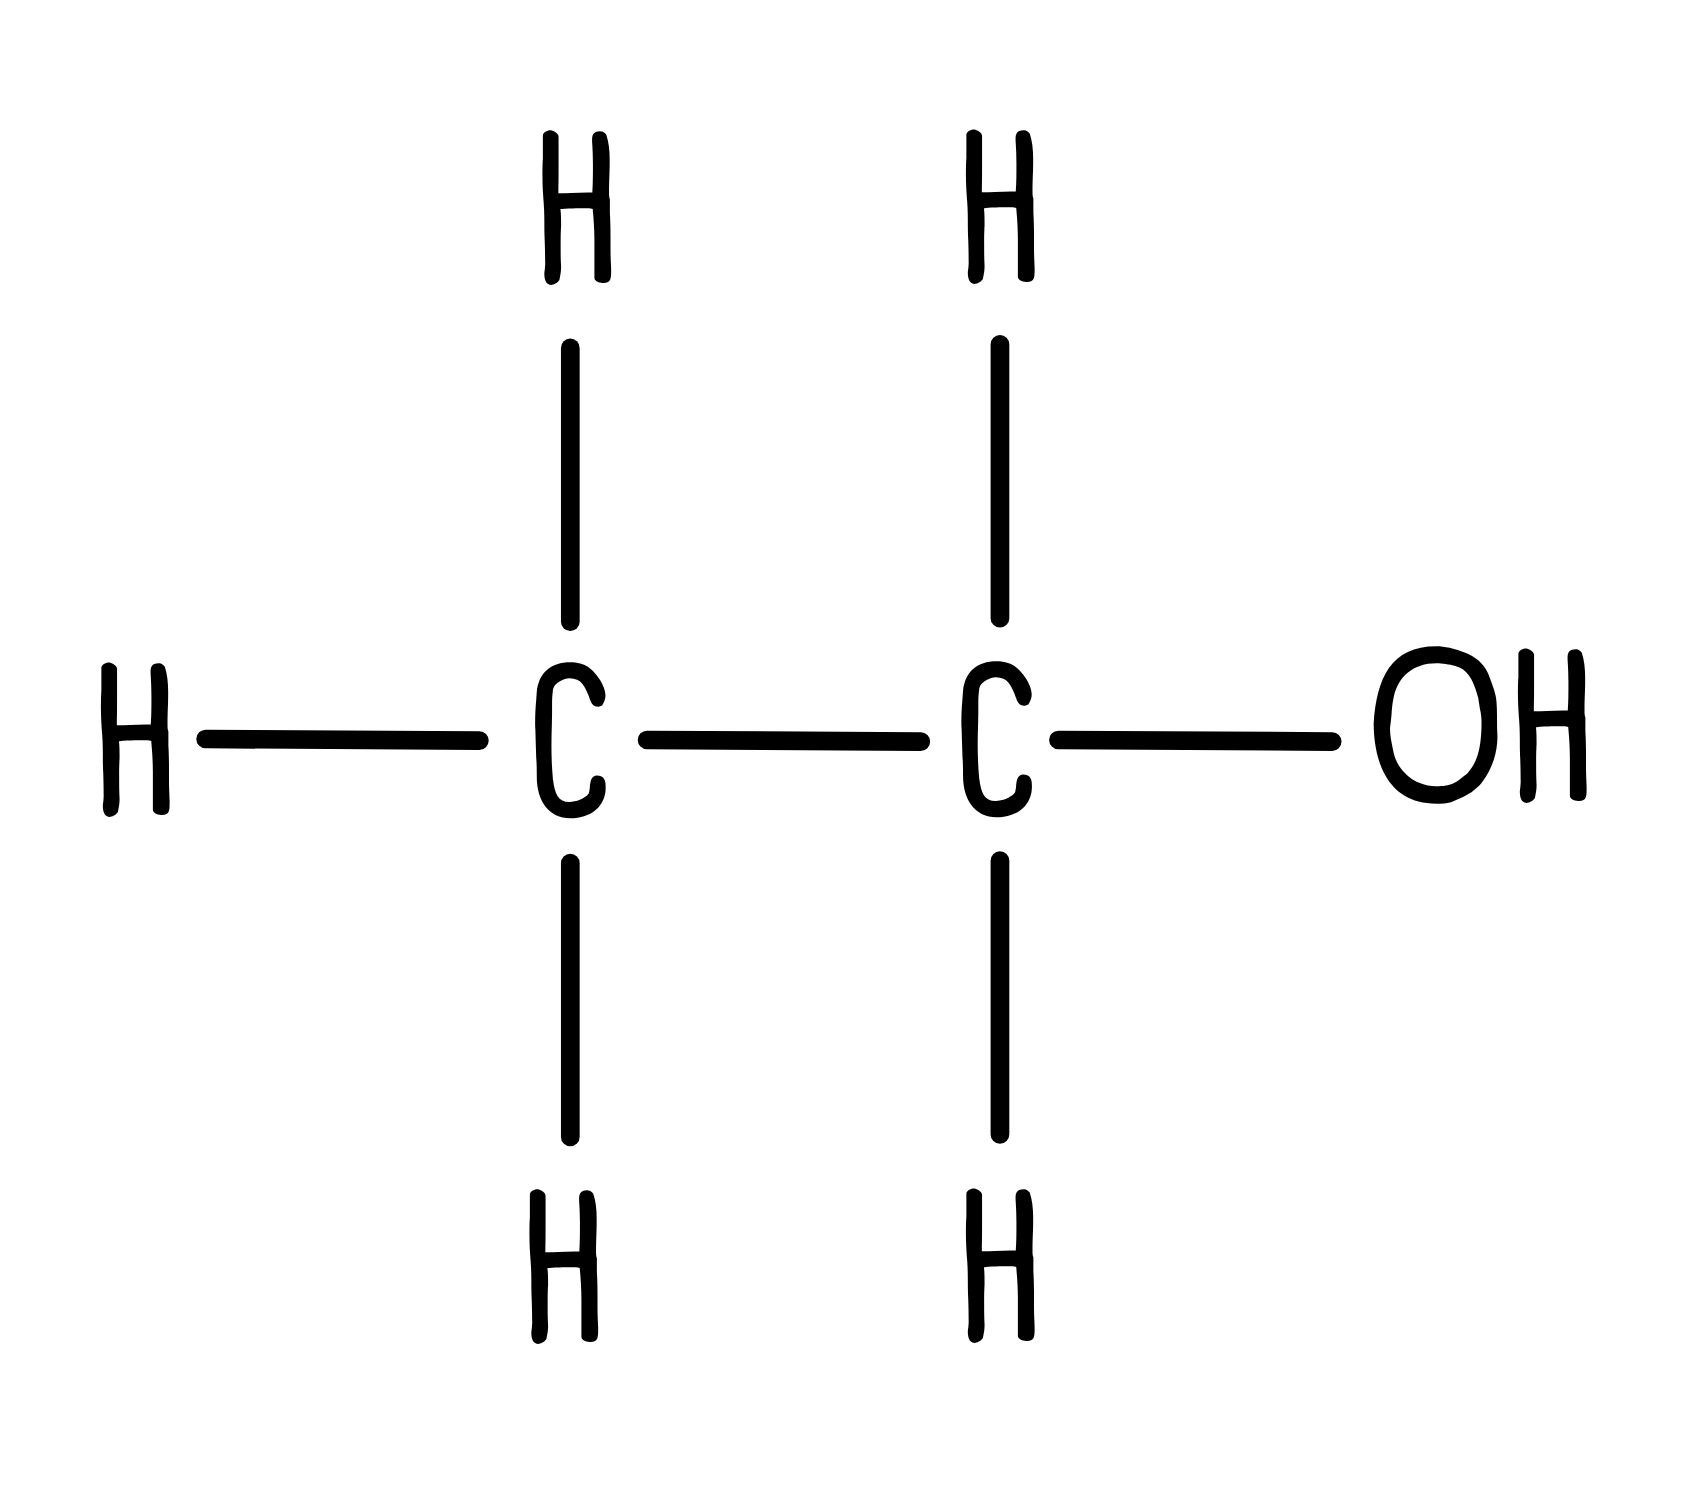
1. How many unique hydrogen environments are there?
We can see three unique hydrogen environments: a CH3, a CH2 and an OH.
2. Where on the chemical shift scale will they appear?
Looking at the data sheet we expect:
- One peak for the R-CH3 between 0.5-2.0 ppm
- One peak for the O-CH2 between 3.0-4.2 ppm
- One peak for the OH between 1.0-12.0 ppm
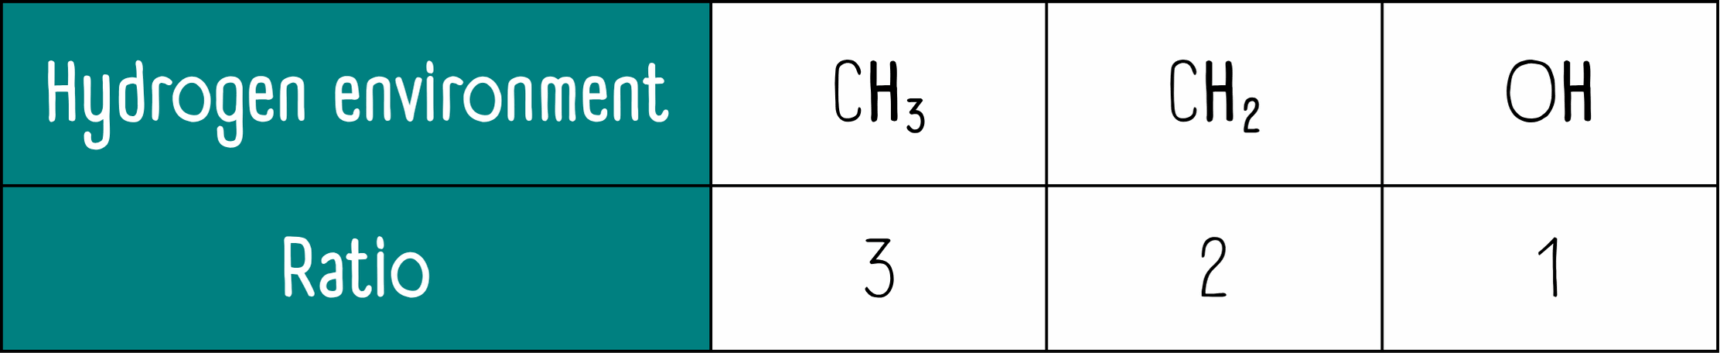
3. What will the integration values be?
We have the following unique hydrogen environments, CH3 : CH2 : OH. The relative ratio for these will be 3 : 2 : 1.
4. Is there any splitting?
- OH won’t be split because the hydrogen is bonded to oxygen. We will see a singlet.
- CH2 is adjacent to a CH3 group. The CH2 will be split into 3 + 1 = 4 peaks, which is a quartet.
- CH3 is adjacent to a CH2 group. The CH3 will be split into 2 + 1 = 3 peaks, or a triplet.
Let’s take a look to see if we are right!

Interpreting NMR spectra is a skill worth perfecting – you will definitely be asked questions involving NMR spectroscopy at some point in A level Chemistry. Fortunately, there are lots of questions to try on Physics and Maths Tutor. Good luck!
Struggling with other aspects of organic chemistry? Check out our student blog articles on naming organic compounds, getting to grips with skeletal formula, and drawing reaction mechanisms.
 Copy URL


Very explicit 💝